Outil de visualisation de la diffusion du COVID avec des données démographiques (comptage de la population, structure par âge…)

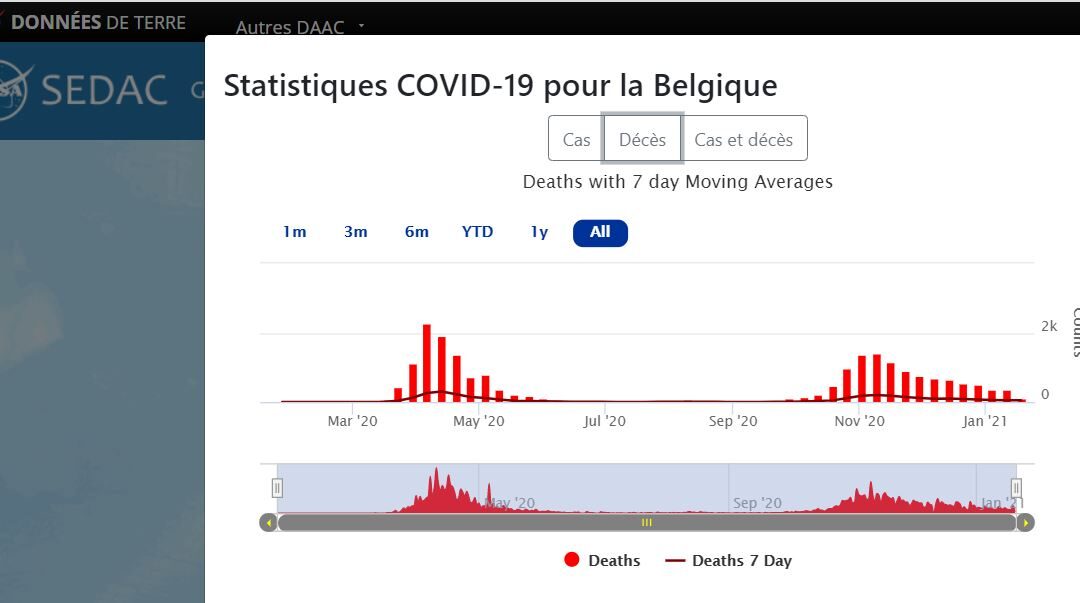
The SEDAC Global COVID-19 Viewer allows users to visualize spatially-explicit trends in COVID-19 infection and mortality rates, including daily updated global data of COVID-19 cases and deaths at a glance in relationship to population density, and several risk factors. A map displays the national prevalence (case) and death rates for the previous seven day, and users can easily zoom in to access subnational data for selected countries (e.g., the US, Brazil, and many countries in Europe). Prevalence and mortality rates summarize the pandemic’s impacts since its beginning. Click on a country to access the pop-up Trends Chart which shows daily and 7-day averages of cases and deaths for a range of select time scales, from 1-month to 6-month and beyond.